Blog categorized as DailyiQ
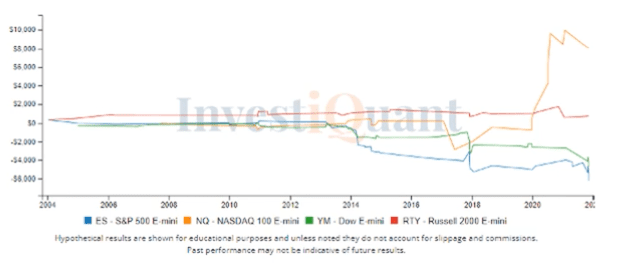
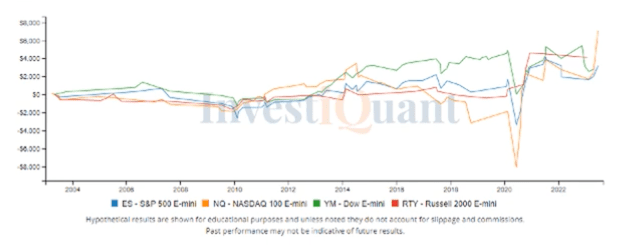
The markets closed above the upper Bollinger band, here is what has happened following that strength. To view the video and summary data, click on the performance graph above or the "Read more" button below.
This is options expiration week, let's see how Tuesdays have performed during this week. To view the video and summary data, click on the performance graph above or the "Read more" button below.
The markets are starting the week lower, here is what has followed in a similar environment. To view the video and summary data, click on the performance graph above or the "Read more" button below.
The markets are overbought coming into the end of the week, here is what that has led to historically. To view the video and summary data, click on the performance graph above or the "Read more" button below.
The markets closed at new highs for the year, here is what has happened following that. To view the video and summary data, click on the performance graph above or the "Read more" button below.
The CPI report is today at 8:30 am ET, here is what has happened historically on the day of the CPI report. To view the video and summary data, click on the performance graph above or the "Read more" button below.
The markets bounced yesterday after the recent pullback, here is what has happened historically following a similar pattern. To view the video and summary data, click on the performance graph above or the "Read more" button below.
The markets closed lower on the Nonfarm Payrolls report, here is what has happened following that session. To view the video and summary data, click on the performance graph above or the "Read more" button below.
The non-farm payrolls report is being released this morning at 8:30 am ET, here is what has happened on this day historically. To view the video and summary data, click on the performance graph above or the "Read more" button below.
The markets are trading weak ahead of the open, here is how weak opens on Thursdays have performed. To view the video and summary data, click on the performance graph above or the "Read more" button below.


